
Page 21 - Roche Hemlibra Non-inhibitors - Product Monograph
P. 21
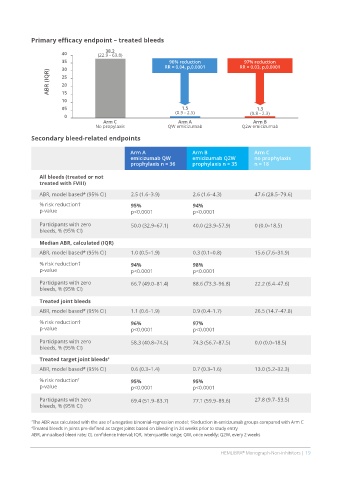
Primary efficacy endpoint – treated bleeds
                                      38.2
                       40          (22.9 - 63.8)
                       35                                   96% reduction              97% reduction
                        30                                 RR = 0.04, p,0.0001       RR = 0.03, p,0.0001
                  ABR (IQR)  25

                       20
                       15
                       10
                       05                                        1.5                       1.3
                        0                                      (0.9 - 2.5)               (0.8 - 2.3)
                                     Arm C                      Arm A                     Arm B
                                   No propylaxis            QW emicizumab             Q2w emicizumab
            Secondary bleed-related endpoints


                                               Arm A                 Arm B                Arm C
                                               emicizumab QW         emicizumab Q2W       no prophylaxis
                                               prophylaxis n = 36    prophylaxis n = 35   n = 18

               All bleeds (treated or not
               treated with FVIII)

               ABR, model based* (95% CI)      2.5 (1.6–3.9)         2.6 (1.6–4.3)        47.6 (28.5–79.6)
               % risk reduction†               95%                   94%
               p-value                         p<0.0001              p<0.0001

               Participants with zero          50.0 (32.9–67.1)      40.0 (23.9–57.9)     0 (0.0–18.5)
               bleeds, % (95% CI)
               Median ABR, calculated (IQR)

               ABR, model based* (95% CI)      1.0 (0.5–1.9)         0.3 (0.1–0.8)        15.6 (7.6–31.9)
               % risk reduction†               94%                   98%
               p-value                         p<0.0001              p<0.0001

               Participants with zero          66.7 (49.0–81.4)      88.6 (73.3–96.8)     22.2 (6.4–47.6)
               bleeds, % (95% CI)

               Treated joint bleeds
               ABR, model based* (95% CI)      1.1 (0.6–1.9)         0.9 (0.4–1.7)        26.5 (14.7–47.8)

               % risk reduction†               96%                   97%
               p-value                         p<0.0001              p<0.0001

               Participants with zero          58.3 (40.8–74.5)      74.3 (56.7–87.5)     0.0 (0.0–18.5)
               bleeds, % (95% CI)
               Treated target joint bleeds ‡
               ABR, model based* (95% CI)      0.6 (0.3–1.4)         0.7 (0.3–1.6)        13.0 (5.2–32.3)

               % risk reduction †              95%                   95%
               p-value                         p<0.0001              p<0.0001

               Participants with zero          69.4 (51.9–83.7)      77.1 (59.9–89.6)     27.8 (9.7–53.5)
               bleeds, % (95% CI)


            * The ABR was calculated with the use of a negative binomial-regression model; †Reduction in emicizumab groups compared with Arm C
            ‡ Treated bleeds in joints pre-defined as target joints based on bleeding in 24 weeks prior to study entry
            ABR, annualised bleed rate; CI, confidence interval; IQR, interquartile range; QW, once weekly; Q2W, every 2 weeks

                                                                               HEMLIBRA  Monograph-Non-inhibitors | 19
                                                                                      ®